
Stats
The Stats page shows trends, patterns, and streaks across your mood history.
Time windows
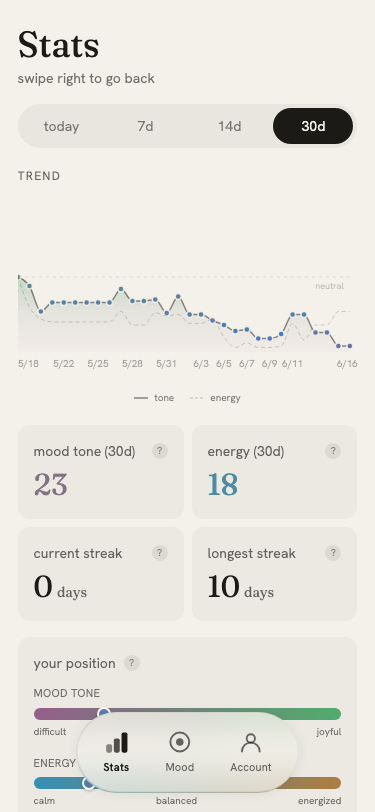
Use the buttons at the top to filter by today, 7d, 14d, or 30d. The trend chart and stat cards all update to match the selected window.
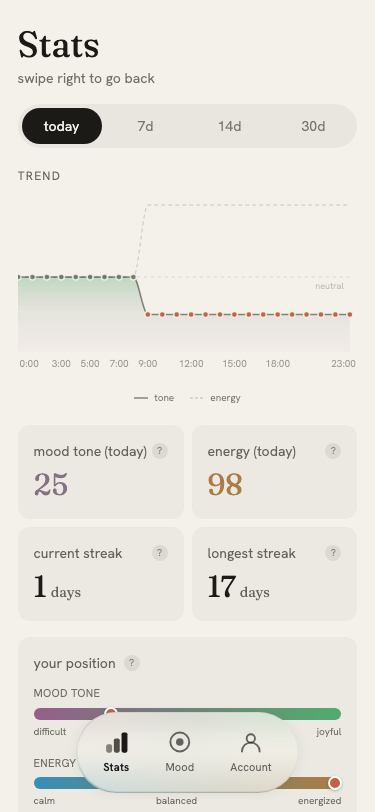
Trend chart
The chart plots your mood over time with two lines:
- Solid line: mood tone (how pleasant vs difficult)
- Dashed line: energy (how calm vs energized)
Each data point is colored with your actual mood color for that day. Hover or tap a point to see the exact scores and mood label in a tooltip.
If astrology is enabled, full moon and new moon markers appear as reference dots on the chart.
Stat cards
Below the chart, a row of cards summarizes your recent mood:
- Mood tone: your average valence score with its color
- Energy: your average arousal score
- Current streak: consecutive days with at least one entry
- Longest streak: your all-time record
Tap the (?) button on any card to read an explanation of what that metric means.
Day-of-week patterns
A bar chart at the bottom shows your average mood for each day of the week across all time. This reveals weekly rhythms: whether Mondays reliably feel harder, or weekends lighter.
Mood axes
Two gradient bars visualize where your average mood lands on each axis:
- Mood tone: a bar from "difficult" to "joyful" with your position marked
- Energy: a bar from "calm" to "energized" with your position marked
A short description below each bar translates the position into plain language.
Check correlation (if checks are enabled)
If you use habit checks, the stats page also shows:
- How often you completed each check in the selected window
- Whether your mood was measurably different on days you completed a check vs days you didn't